Upload your press release
DAT Truckload Volume Index jumped 11% in June
Truckload freight volumes hit new highs in June and spot and contract rates stayed in record territory as surging retail imports and peak produce shipments fueled demand for transportation services, according to DAT Freight & Analytics, operator of the largest truckload freight marketplace in North America.
The DAT Truckload Volume Index was 237 in June, an 11% increase compared to May and a record high. The Index is an aggregated measure of dry van, refrigerated (“reefer”) and flatbed loads moved by truckload carriers and an industry-standard indicator of commercial freight activity. A baseline of 100 reflects freight volume in January 2015.
Rates remain near all-time highs
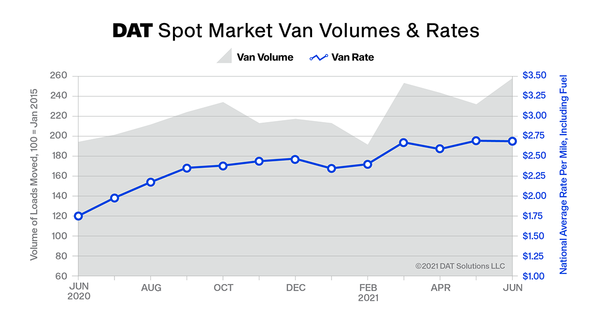
The national average rate for van loads on the DAT One load board network was $2.68 per mile in June, down 1 cent from the all-time high in May (all rates include a fuel surcharge).
The national average spot rate for refrigerated freight fell 1 cent to $3.10 per mile month over month while the flatbed rate increased 3 cents to $3.15.
Contract truckload rates set records for all three equipment types. The average van rate was $2.73 per mile, up 6 cents compared to May. The contract reefer rate increased 3 cents to $2.88 per mile, while the flatbed rate jumped 7 cents to $3.10 per mile.
Spot load postings decline as more freight moves under contract
Overall truckload volumes increased last month but the number of loads posted to the DAT One network fell 6.0% compared to May. This marked a shift from the spot market toward more freight moving under contract or other means.
The number of available trucks on DAT One increased 13.2% compared to May. Although capacity remains tight, there are signs that workers are coming back to the industry, with 24,500 new transportation jobs added in June.
With fewer loads on the spot market and more trucks available, load-to-truck ratios declined for all three equipment types. The national average van ratio was 5.6 in June, meaning there were 5.6 available loads for every van posted to the DAT network, down from 6.1 in May. The reefer ratio was 11.6, down from 13.0, and the flatbed ratio slipped from 97.1 in May to 66.8 last month.
In June, shippers faced a supply-driven capacity crunch, said Ken Adamo, Chief of Analytics at DAT: “While the number of trucks posted to the DAT load board network increased significantly in June, overall demand accelerated at a faster pace. The typical seasonal decline in contract and spot rates from now to Thanksgiving looks less likely in 2021.”
July outlook
Spot truckload rates typically drop after the July 4 holiday with back-to-school and back-to-office retail goods already positioned and produce season past its peak. In some cases, reefer carriers will shift to moving dry van and other types of freight, which could provide relief to retailers seeking transportation services for end-of-year holiday goods.
Usually, 12 to 15% of all truckload volume moves on the spot market. Entering July, that figure is closer to 25% but should tighten as more shippers take a portfolio-based transportation procurement strategy (dedicated, contract and spot, as well as using a mix of both asset and non-asset providers).
Between July 4 and Thanksgiving, weekly truckload volumes of produce typically decline an average of 21%, which translates to reefer carriers hauling 7,300 fewer truckloads per week by the end of November.
Comparing rates entering the market to those exiting shipper routing guides, contract rates were rising at the beginning of July: new routing guide contract rates increased by 7% in the two weeks ending July 1 compared to the prior two-week period. We expect contract rates to remain elevated at least through the fall.
About the DAT Truckload Volume Index
The DAT Truckload Volume Index reflects the change in the number of loads with a pickup date during that month; the actual index number is normalized each month to accommodate any new data sources without distortion. Baseline of 100 equals the number of loads moved in January 2015, as recorded in DAT RateView, a database of rates paid on an average of 3 million loads per month. DAT national average spot rates are derived from RateView and include only over-the-road lanes with lengths of haul of 250 miles or more. Spot rates represent the payments made to carriers by freight brokers, third-party logistics providers and other transportation buyers.
About DAT Freight & Analytics
DAT Freight & Analytics operates the largest truckload freight marketplace in North America. Shippers, transportation brokers, motor carriers, news organizations and industry analysts rely on DAT for market trends and data insights derived from 226 million freight matches and a database of $126 billion in annual market transactions. Founded in 1978, DAT is a wholly owned subsidiary of Roper Technologies (NYSE:ROP), a diversified technology company and constituent of the S&P 500, Fortune 1000 and Russell 1000 indices.