Steady as she goes

Former New York Mayor Ed Koch was well known for asking the question, "How'm I doing?" as he prowled the city. His goal was to get a street-level view of his performance.
Nine years ago, DC Velocity and its research partners set out to look at how warehouse and distribution center managers dealt with essentially the same question—that is, what steps they were taking to assess how their own operations were doing. The result was the launch of our annual metrics study, which tracks the measures DC professionals are using to monitor their operations as well as changes and trends in overall performance against those metrics from year to year. The study also provides valuable benchmarks managers can use to see how their operations stack up both within the company and against their competitors.
Since the inception of this study, our focus has been on the operational side of performance—the number of labels licked and boxes kicked per hour, or the percentage of orders sent damage-free. You name the measure, and if it's important to the industry, we have the metric.
More recently, however, we have been turning our attention to metrics of another sort—what we might call the "soft" side of logistics. But more on that later. First, we'll take a look at what we learned this year.
Which metrics matter most?
This year's study was conducted among DC Velocity's readers and members of the Warehousing Education and Research Council (WERC) by researchers from Georgia Southern University and the consulting firm Supply Chain Visions. While the number of responses to the survey, which was carried out via an online questionnaire in January, was relatively large (in excess of 225 for 2012), it did not match last year's usable responses. In order to increase the predictive power of the benchmarks, researchers combined the 2012 results with 2011's, for a total of 802 participants.
Respondents were asked to identify the metrics they used in their operations as well as to grade their own facilities' performance against 44 specific operational measures. For purposes of analysis, the measures have been grouped into five balanced sets: customer, operational, financial, capacity/quality, and employee.
As for what performance metrics are most favored by DC and warehouse professionals, the study has shown that the top measures don't vary much from year to year. For 2012, the most frequently employed metrics were on-time shipments, order picking accuracy, and average warehouse capacity used. Those same three measures also topped the previous year's list, albeit in a slightly different order.
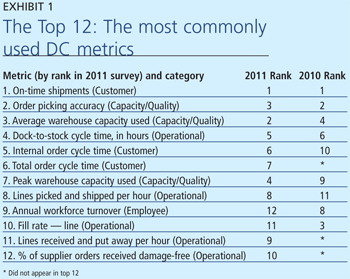 In fact, as Exhibit 1 shows, there has been little change in the top 12 metrics used by the industry in the past three years—for example, the only change in this year's rankings from 2011 was a slight variation in the order of the top 12. (We should point out that we made a change in methodology last year in calculating the top 12 list, which caused some shifts in the rankings against previous years.)
Also worth noting here is that the three measures related to cycle time—4, 5, and 6 in 2012—have steadily increased in importance since 2010, suggesting that DC managers are recognizing that a "supply chain" type view of performance is important in addition to considering individual activities.
If we dig a bit further into the results for a handful of the metrics, we note that after several years of steady improvement, performance in general seems to have leveled off somewhat. Given the profile of the respondents—members of a professional organization and/or readers of a leading logistics industry publication—you might expect to see a continuation of the long-term trend of performance improvement. However, logic dictates that we will eventually reach a point of saturation, and we believe we are nearing this point.
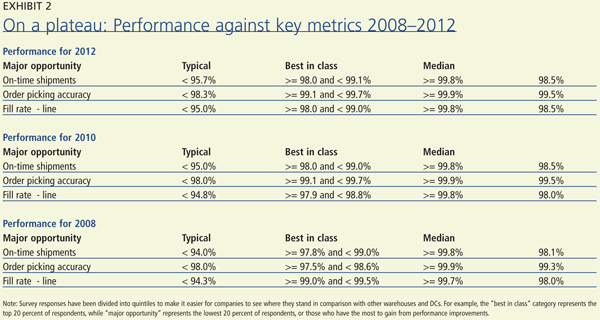
In addition, we have noticed a continued tightening of the measures. In other words, the gap between best-in-class companies (the top-performing organizations) and "major opportunity" companies (the bottom performers) is growing smaller, or at least not widening.
Take on-time shipments, for example. Exhibit 2 shows the performance for companies categorized as "major opportunity" (the lowest 20 percent of respondents), "typical" (the middle 20 percent), and "best in class" (the top 20 percent), along with the median numbers for 2008, 2010, and 2012. The best-in-class performers, which had almost nowhere to go, remain near perfect. Typical performers' numbers also remain essentially unchanged, while those in the "major opportunity" category made small gains when it came to getting shipments out the door on time. The results for order picking accuracy and fill rate are similar.
In terms of performance, we believe the metric to watch over the next couple of years will be annual workforce turnover. As Exhibit 3 shows, the turnover rates among best-in-class and median performers are at or near their lowest points since 2007, when we first began to break out the data by quintiles. As economic activity heats up, we expect to see these numbers return to 2007 levels, when the median turnover rate was 14 percent.
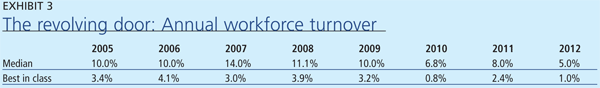
Why? In 2006, the national unemployment rate hovered around 4.5 percent, with jobs added at the rate of about 200,000 a month. (Keep in mind that the 2007 survey report was based on data from 2006.) The low unemployment rate meant greater opportunities for workers in search of better pay or working conditions.
Contrast that to the situation in 2011, when the high rate of unemployment likely deterred workers from leaving steady jobs. It's probably no surprise that the median turnover rate dropped to 5 percent from 8 percent the previous year, an improvement of 37 percent. (The best-in-class performers, by the way, have maintained relatively low turnover rates despite wide fluctuations in the economy.)
Now, unemployment is at its lowest rate since February 2009, making the economic environment more conducive to worker mobility than it's been for some time. We suspect that as confidence in the economy grows, more employees will start to seek greener pastures, and the turnover rate will rise.
What's next?
As we've noted, the gap between the best- and weakest-performing DCs has narrowed or stayed the same in recent years. That raises the question of what will emerge as the next competitive differentiator. We would argue that as facilities continue to close the gap in operational performance, attention will turn to what we call the "soft" side of performance—how human beings interact with one another in the workplace. That's because skills like the ability to communicate effectively and build and maintain relationships—whether with colleagues, suppliers, or customers—have a measurable impact on both operational performance and customer satisfaction. (See Exhibit 4 for some examples.)
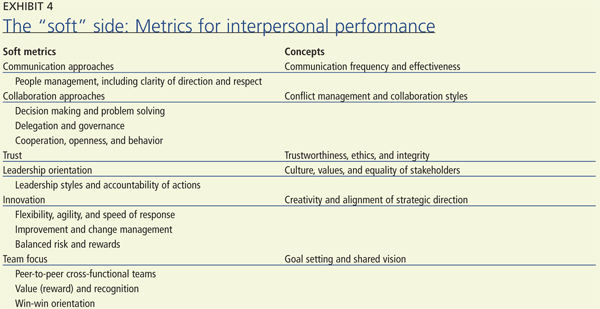
To put it another way, the effectiveness of an organization's relationship with customers and suppliers depends heavily upon non-operational elements of performance: employees' ability to communicate well, personally interface with counterparts at other companies, make mutually beneficial decisions, solve problems jointly, and collaborate. Ignoring these interpersonal aspects of performance can often have negative long-term effects on relationships, which is likely to have severe consequences for a company as a whole.
To develop a true picture of supply chain success, then, organizations must measure both the "what" (operational) and the "how" (interpersonal) aspects of performance. The importance of these soft skills dictates a need for a new generation of business metrics and scorecards designed to gauge both sides of performance.
In the upcoming years, research will be needed to explore how these attributes should be defined, calculated, and tracked. It is significantly different from previous metrics and benchmarking studies, as many of the measures are relatively new. The University of Tennessee and Georgia Southern University have already started researching companies that are taking a hard look at the soft side of performance.
Editor's note: The full results of the study will be available at www.werc.org after the annual WERC conference in Atlanta May 6-9. To read more about the "soft" side of metrics, see "A hard look at the soft side of performance," which appeared in the Quarter 4/2011 edition of DC Velocity's sister publication, CSCMP's Supply Chain Quarterly.