On the up and up

In the decade that we've been tracking distribution center performance through our annual study on metrics, one trend has stayed absolutely constant: DC and warehousing operations continue to show slow and steady improvement. That remains true this year.
In spite of the sluggish recovery, companies are working to improve their DC performance with an intense focus on the velocity of inventory flowing through their facilities. This year's survey found that respondents have been paying particular attention to their inbound operations, and performance against those measures is showing marked improvement as a result. That's especially true of the so-called "major opportunity" respondents—those whose performance ranked in the bottom 20 percent of survey participants and therefore, have the most to gain.
The annual research, performed via an online survey earlier this year, was conducted among DC Velocity readers and members of the Warehousing Education and Research Council (WERC). Respondents were asked both what metrics they use and how well their operations performed against 44 key DC and warehousing measures in 2012. (For purposes of analysis, the measures have been grouped into five categories: customer, operational, financial, capacity/quality, and employee.) The study is jointly sponsored by **{DC Velocity} and WERC with support from Kenco and Kronos.
The study aims not only to determine which metrics are important to DC and warehousing professionals, but also to understand the underlying trends and changes in performance from year to year. In addition, the research provides valuable benchmarks against which managers can gauge their own facilities' performance within the company and against their competitors. (The full results will be incorporated into a report written by Tillman and Manrodt and will be available at www.werc.org after the annual WERC conference in Dallas April 28-May 1.)
WHICH METRICS MATTER MOST?
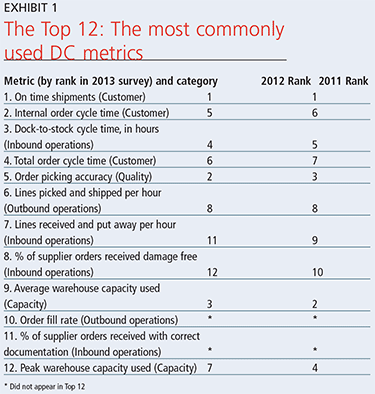
When it comes to the performance metrics used by DC professionals, the survey showed that the top choices don't vary much from year to year. A number of this year's most frequently cited metrics—including "on-time shipments," "average warehouse capacity used," and "order picking accuracy"—have appeared on the list since the study was launched.
 But that's not to say the situation is static. As Exhibit 1 shows, there have been some changes in the list of the Top 12 most commonly used metrics compared with the previous year's lineup. Not only were there some shifts in the rankings, but we also noted some shuffling among the entries themselves. For instance, this year's list includes two metrics that didn't make it into last year's lineup: "order fill rate" and "percentage of supplier orders with correct documentation." They displaced "fill rate—line" and "annual workforce turnover."
The disappearance of "annual workforce turnover" from the lineup is worth noting. As recently as 2010, it ranked fourth on the list of most popular metrics. One possible explanation is that it simply wasn't a top-of-mind concern for companies last year—performance against this metric improved across the board. However, companies should be aware that losing sight of a facility's most valuable asset—its employees—may eventually lead to performance issues in other areas. That being the case, we would encourage DCs and warehouses to keep a close eye on job numbers. The unemployment rate dropped to 7.7 percent in February, and as the recovery picks up steam, more employees may become confident enough about the job market to start seeking other opportunities.
As for the overall list of most widely used metrics, it's also important to note that in some cases, decisions about which metrics to use are dictated by company policy and may not reflect what the respondents themselves would choose. For that reason, the survey included a question asking, "If you were the boss, what metrics would you use to run the DC or warehouse?"
As it turned out, there were some disparities in the metrics respondents were using and the ones they would personally select. Although two metrics—"order picking accuracy" and "order fill rate"—appeared on both lists, the respondents' top five picks included three that did not figure among the Top 12: "inventory count accuracy by location" as well as two financial metrics, "distribution costs as a percentage of sales" and "distribution costs per unit shipped." Clearly, the focus for warehouse managers is on veracity, value, and velocity.
HOLDING THEIR OWN
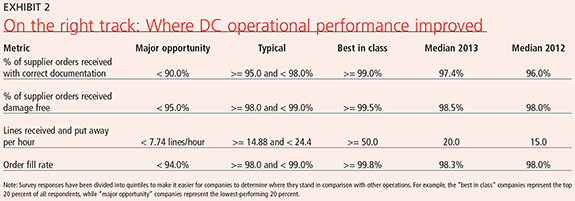
As for how facilities are performing against those metrics, the news is generally good. A comparison of this year's results with median performance numbers from 2012 shows that companies either maintained or improved their performance against 25 of the 44 metrics studied. Best-in-class performers were able to either maintain or improve their performance on 29 of the 44 metrics. The "major opportunity" respondents made a particularly strong showing this year, narrowing the performance gap with their more advanced brethren on 25 of the 44 metrics.
That raises the question of where the biggest improvements were made. In the past, we've looked at performance against all 44 metrics when compiling the rankings. But this year, we decided to do things a little differently. In light of respondents' intense interest in all things operational, we've narrowed our focus to performance against operations-related metrics.

Exhibit 2 identifies the operational metrics that saw the biggest performance improvements over last year. If nothing else, the findings indicate that respondents' efforts to streamline operations are paying off. Take "lines received and put away per hour," for example. In this area, both median and "major opportunity" respondents were able to improve their performance by over 30 percent.
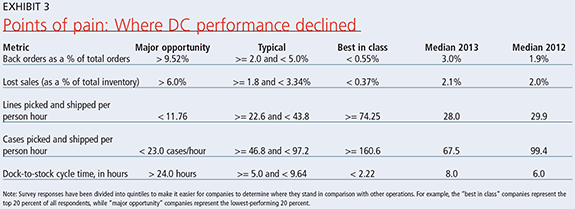
That's not to say the picture is totally rosy, however. The study also identified areas where performance has slipped—the so-called "points of pain."

The metrics that took the biggest hit this year were "back orders as a percentage of total orders" and "lost sales as a percentage of total inventory." (See Exhibit 3.) Why these? We think the slippage in performance could be related to a drop in inventories. After the stock buildup from the Great Recession, inventories seem to have returned to more normal levels (in fact, the study pointed to an across-the-board drop in days of finished-goods inventory on hand). Incidentally, those low inventories and the resulting need for facilities to quickly replenish stock to avoid back orders might also help explain the heightened interest in the velocity of inbound operations.
GETTING BETTER ALL THE TIME
Overall, it appears most warehouses and DCs are moving in the right direction as far as performance is concerned. Whether the momentum can be sustained or not, especially as companies experiment with same-day delivery, only time will tell. In the meantime, we invite you to send us your comments, suggestions, and insights into the research and your own use of measures.
Related Articles
Copyright ©2024. All Rights ReservedDesign, CMS, Hosting & Web Development :: ePublishing