Heavy traffic ahead
New study ranks the nation’s most congested cities.
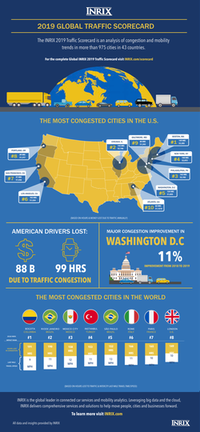
Road congestion is one of the perennial challenges of last-mile delivery, and the problem is getting worse. From 2017 to 2019, the average time lost by American drivers increased by two hours—reaching 99 hours per year—due to continued economic and urban growth, according to a study by transportation analytics provider Inrix Inc.
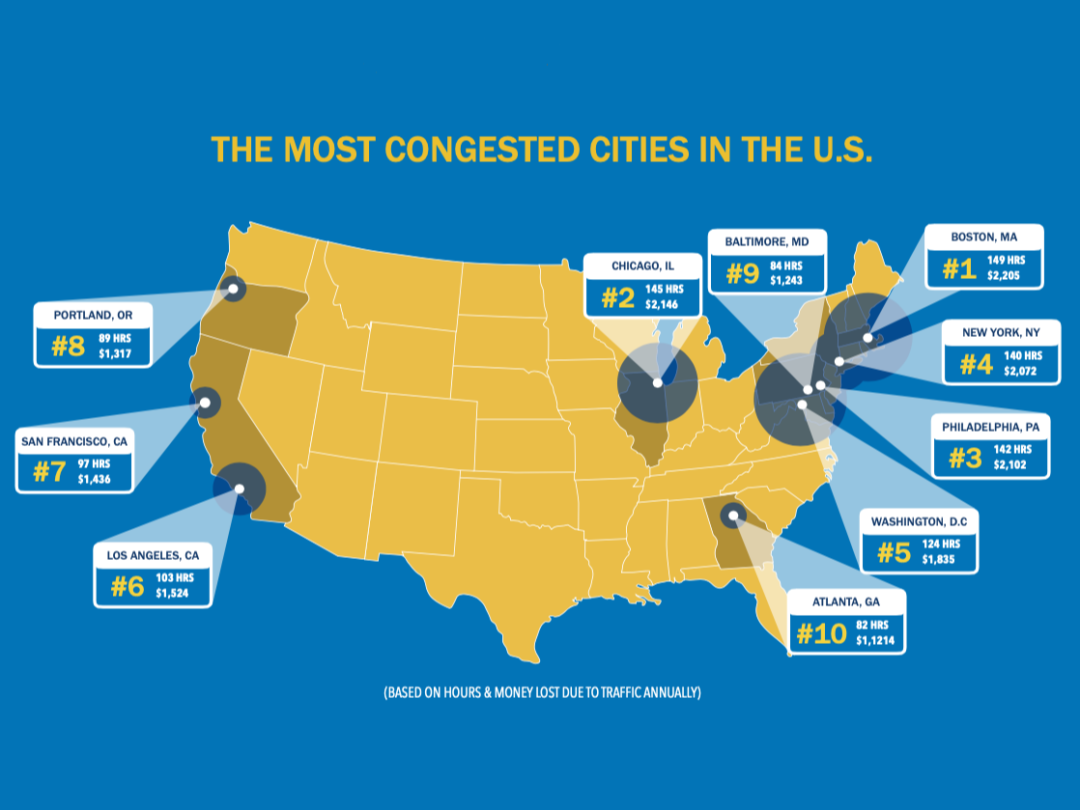
To identify the top U.S. troublespots, Kirkland, Washington-based Inrix analyzed congestion and the severity of it in the nation’s top 66 urban areas. For the second consecutive year, Boston ranked as the most congested city in the U.S., with the average commuter in the metro area losing 149 hours per year to congestion, according to the 2019 Global Traffic Scorecard. Boston was followed by Chicago (145 hours), Philadelphia (142 hours), New York City (140 hours),and Washington, D.C. (124 hours). At the other end of the scale, Wichita, Kansas, had the lowest levels of congestion among U.S. cities, with drivers losing less than two hours a year.
Rounding out the top five were Chicago (145 hours), Philadelphia (142 hours), New York City (140 hours),and Washington, D.C. (124 hours). At the other end of the scale, Wichita, Kansas, had the lowest levels of congestion among U.S. cities, with drivers losing less than two hours a year.
“Congestion costs Americans billions of dollars each year. However, it appears to be stabilizing in some of the country’s most congested metros – with delays rising roughly 3% nationwide since 2017,” noted Trevor Reed, transportation analyst at Inrix, in a release. “The continued innovation and investment in smarter roadway management is showing early signs of progress.”